This experiment demonstrates the use of two popular electrochemical techniques—cyclic voltammetry and potential stepping in controlling electrochemical processes and the use of AFM to simultaneously monitor the on-going processes real-time in-situ. Copper (Cu) electrodeposition/stripping is carried out in 20 mM CuSO4 on HOPG (highly ordered pyrolytic graphite) with a platinum (Pt) ring counter electrode and Cu wire quasi-reference electrode. HOPG is chosen as the working electrode (sample) because it can be readily cleaved using scotch tape to obtain a fresh surface.
![]()
Figure 1: Cyclic voltammetry settings
With the parameter settings above, using the HOPG sample, Pt ring, Cu wire, and 20 mM CuSO4 solution, select Potentio > CV Increase from the menu bar to obtain graphs similar to the ones displayed below:
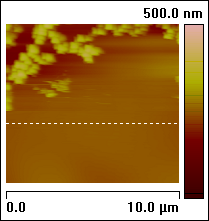
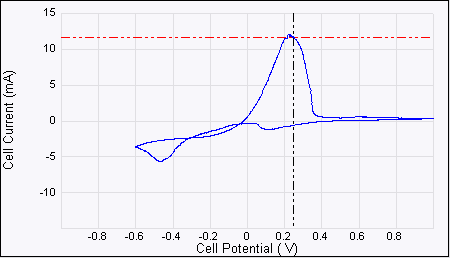
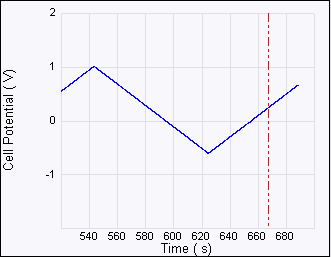
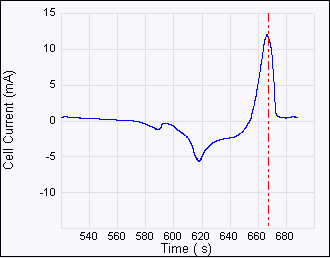
Figure 2: ECAFM image and cyclic voltammogram taken simultaneously, conditions are working electrode (sample): HOPG, counter electrode: Pt ring, reference electrode: Cu wire, solution . Potential: CV Increase, Ramp Minimum: –600 mV, Ramp Maximum: 1000 mV, Ramp rate: 20 mV/s.
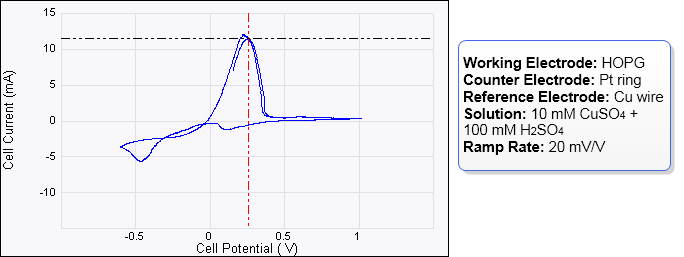
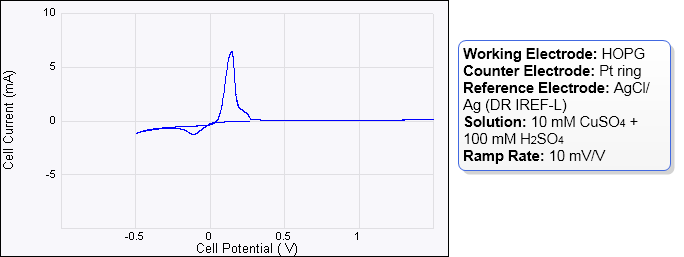
Figure 3: The cyclic voltammogram can vary depending on conditions such as CuSO4 concentration, reference electrode material, ramp rate, purity of the solution and cleanliness of the sample. It must however show negative current (not necessarily peak) and positive peaks.
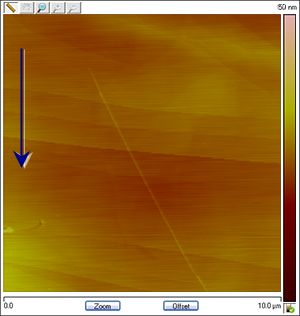
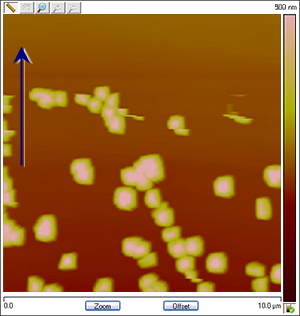
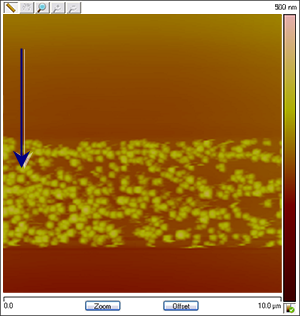
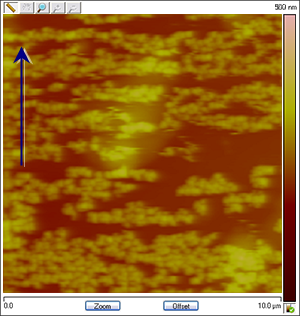
Figure 4: The images change in association with the applied potential. The process is reversible: Cu particles are created and dissolved as Cu deposition and stripping takes place. The images below are assembled from different runs to show that the variation in shape and coverage of Cu deposits on HOPG depending on changing conditions such as CuSO4 concentration, reference electrode material and ramp rate. The arrows show the scan direction of the images.
The potential can be changed in a stepwise manner. The potential affects the dynamics of the electrochemical reaction, as manifested by the population of nucleation and crystal size in the given system.
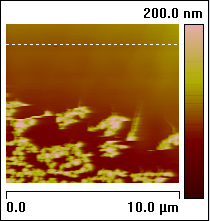
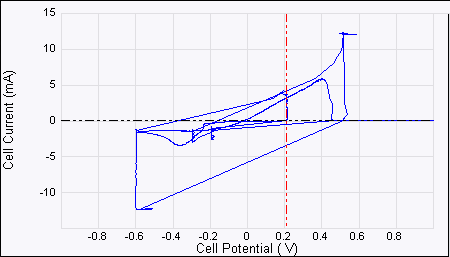
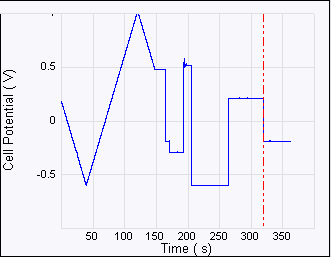
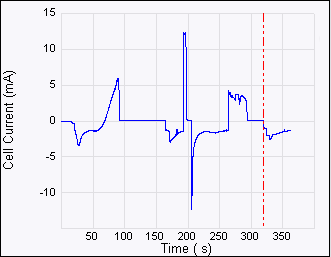
Figure 5: ECAFM image and voltammogram taken by selecting
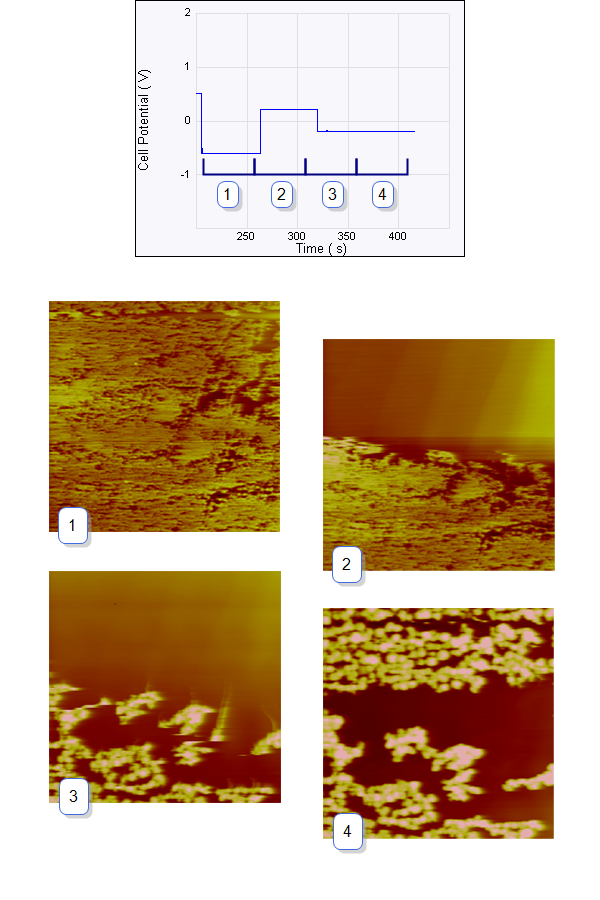
Figure 6: Consecutive ECAFM images correspond to each time zone on the Potential—time plot (top). From left to right the potential steps are from +500 mV to –600 mV, –600 mV to +200 mV and +200 mV to –200 mV. The arrows show the scan direction of the images. The positive potential strips Cu from the surface and the negative potential dictates the nucleation behavior—more negative potential leads to more but smaller Cu crystals. Experimental conditions are: working electrode (sample): HOPG, counter electrode: Pt ring, reference electrode: Cu wire, solution 20 mM CuSO4.
| www.bruker.com | Bruker Corporation |
| www.brukerafmprobes.com | 112 Robin Hill Rd. |
| nanoscaleworld.bruker-axs.com/nanoscaleworld/ | Santa Barbara, CA 93117 |
| Customer Support: (800) 873-9750 | |
| Copyright 2010, 2011. All Rights Reserved. |